Magento 2 New Relic Integration: 10 Key Capabilities of New Relic APM
Are you wondering how to get real-time insights into your store’s performance? Magento 2 New Relic Integration connects your store to New Relic. It is a tool for real-time performance tracking. The APM software helps you monitor how your store performs.
This article will cover how to improve performance and use New Relic.
Key Takeaways
-
What are the aspects of Magento 2 New Relic integration?
-
New Relic APM boosts application performance and keeps your site reliable.
-
Key capabilities of New Relic APM for internal references and accurate reporting.
-
Comparisons between Magento 2 New Relic integration with other APM software.
-
Avoid mistakes like misconfiguring the PHP agent's automatic transaction naming.
-
Case studies show how New Relic in Magento 2 helps businesses.
-
Future trends will enhance New Relic infrastructure and software analytics for better tracking.
What is Magento 2 New Relic Integration?
Magento 2 New Relic Integration connects Magento store with your New Relic account. It can monitor and improve application performance.
Magento 2 new relic integration works for both Magento 2 and Magento 1 users. It also works for those using Adobe Commerce on Cloud Infrastructure. Using New Relic insights can make the store faster and more reliable. It helps gather data for informed decisions using software analytics services. It includes:
-
Web transactions
-
Database queries
-
Application data.
What Can You Use New Relic Reporting APM For?
1. Monitoring New Relic Infrastructure
New Relic APM provides a system to track application performance for Magento microservices. It gives detailed code-level analysis. Monitoring helps users analyze and improve application interactions for easier troubleshooting. They can monitor the app's performance on the New Relic APM Summary page. In New Relic APM, transactions refer to receiving an HTTP request to send a response.
It shows key performance metrics like:
-
Transaction response time: Time taken to process a request. It does not show the total transaction time.
-
Apdex score: A measure of user satisfaction based on response times compared to a set limit.
-
Throughput: The number of requests per minute (RPM).
-
Error rate: The percentage of transactions with errors during a set time.
-
Used host resources: Tracks hardware usage, including CPU and memory.
2. Set Up and Use New Reporting and Alerting

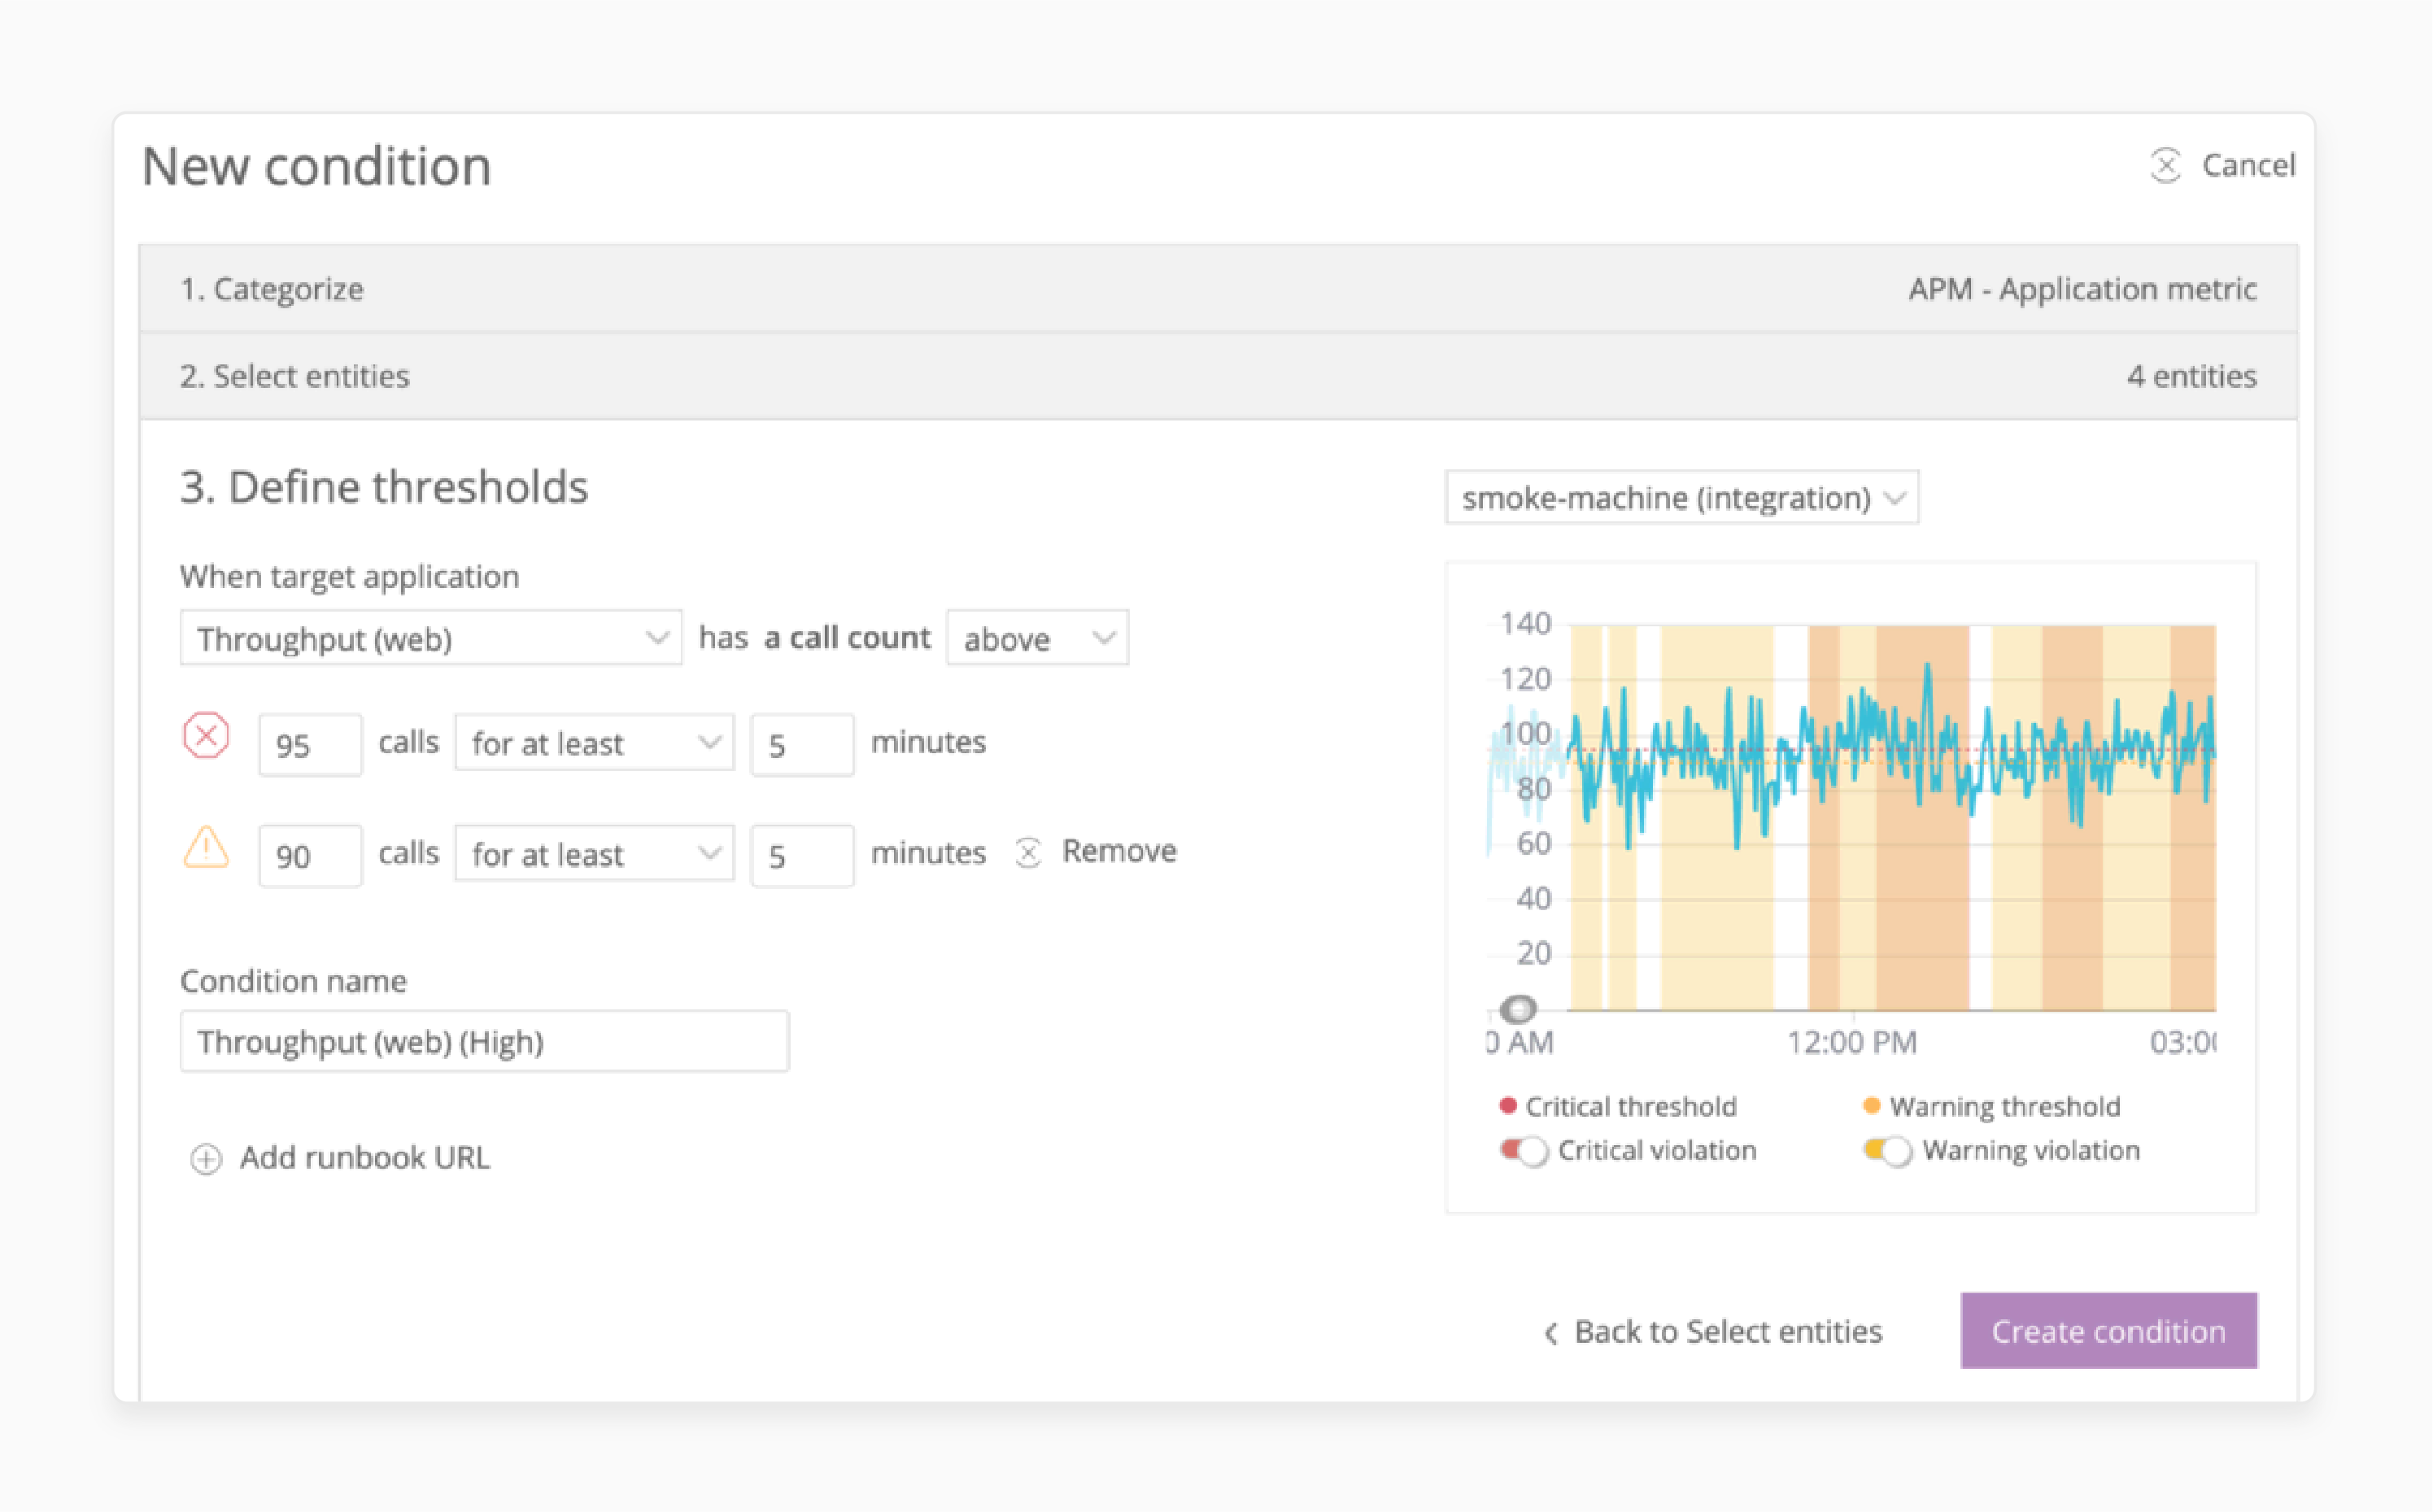
New Relic APM offers SLA reporting to track uptime, downtime, and performance trends. Reports are available daily, weekly, or monthly. They depend on the account settings. It can be viewed or downloaded from the New Relic account dashboard. The platform also has New Relic APM Pro. It offers advanced alerts for performance issues.
Users can customize alerts by:
-
Monitored data source: Choose the parts of the app to monitor.
-
Violating behavior: Set conditions that trigger alerts when performance drops.
-
Incident preference: Decide how often users want to receive alerts.
-
Notification methods: Choose how you get notifications, like email, Slack, or other channels.
3. Building Magento 1 Dashboards

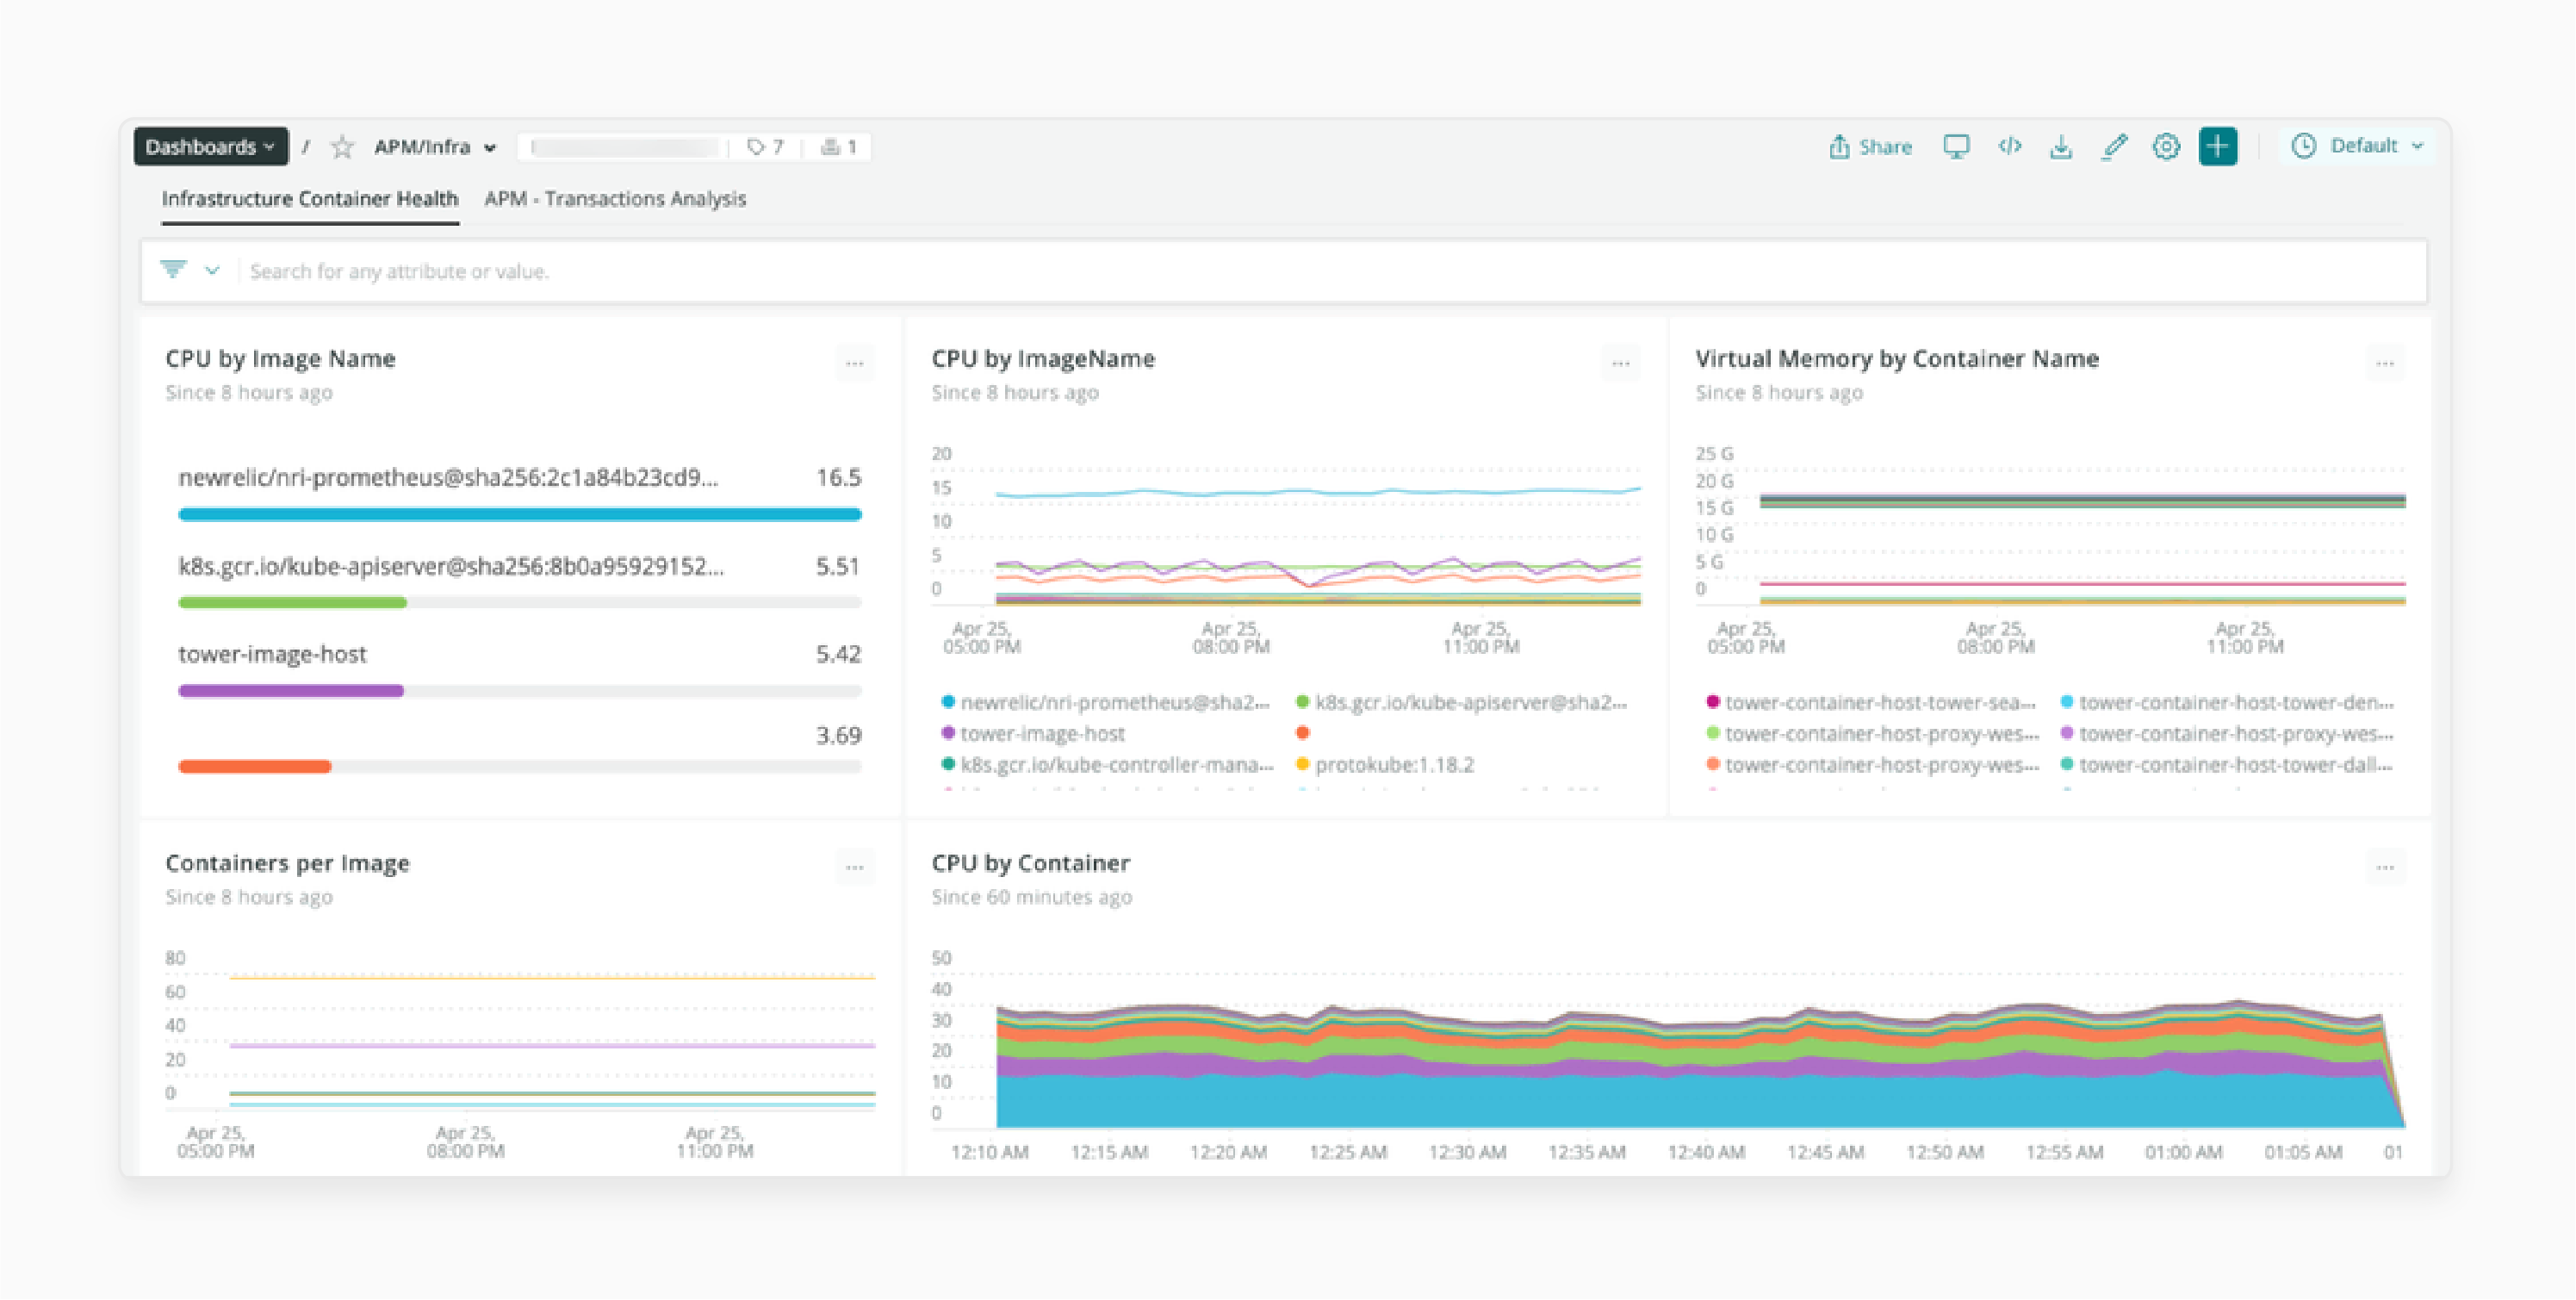
New Relic’s customizable dashboards allow users to track application performance. The dashboards use visual and color-coded graphs to make monitoring easier. They can customize dashboards by:
-
Adjusting the layout, resizing charts, and choosing what information to display.
-
Creating multiple dashboards for different regions or production environments.
-
Sharing dashboards with other Magento 1 teams for improved collaboration.
4. Checking Traces and Logs
New Relic lets users check both transaction traces and logs. These are essential for spotting performance problems. Combining traces and logs helps you solve issues faster and more accurately. Users can:
-
View detailed transaction logs and database calls.
-
Drill down to find the Magento services or transactions causing slowdowns.
-
Match log messages with traces to quickly troubleshoot and fix Magento errors.
Monitoring Performance with Magento 2 New Relic Integration
| Feature | Details | Advantages |
|---|---|---|
| Database Query Performance | Tracks the execution time of database queries. It uses the insights API of Magento 2 to find slow queries. | Helps optimize slow queries to improve application performance. It shows which queries impact performance most. |
| Deployment Impact Monitoring | Tracks the effects of new deployments on the store’s performance using New Relic's APM. | Helps spot performance problems after updates. It lets the users fix issues quickly or roll back changes if needed. |
| Server Resource Usage | Monitors CPU, memory, and disk usage in Magento 2 commerce cloud environments. It checks resource use. | Helps you decide when to increase resources. It keeps the Magento 2 ecommerce store running smoothly during high traffic. |
| Tracking Across Environments | Monitors both production and staging environments using application performance monitoring tools. | Lets you test in staging environments safely and ensures smooth performance in production. |
| Error Tracking | Detects and logs errors across the Magento 2 store. It uses New Relic's PHP agent for deeper insights. | It allows users to fix critical Magento 2 errors quickly. Error tracking prevents downtime and reduces the impact on application performance. |
| Performance Trend Analysis | Uses software analytics services to study performance trends. It finds repeating issues over time. | Improves long-term performance by addressing common problems and planning for busy periods. |
| Customizable Dashboards | Provides customizable insights dashboards. It tracks key metrics like key transactions and resource use. | Gives real-time insights so users can respond quickly and efficiently. It tracks the application data that matters most. |
10 Key Capabilities of New Relic APM Integration
-
Real-Time Instrumentation and Analytics: New Relic APM service gives real-time insights. Once you set up New Relic into Magento 2 performance. Users can monitor key metrics instantly, helping fix problems quickly.
-
Flexible Instrumentation: You can create a new API or use APM software. It can monitor application performance. With flexible data collection options like API keys. Users can track performance to fit their needs.
-
Guided Engineer Responses: New Relic’s software analytics service helps developers. The developers identify the configuration for internal issues and provide easy-to-follow solutions. It makes troubleshooting the errors of Magento 2 faster and smoother.
-
Correlates Performance to User Experience: New Relic connects application data and performance analytics. Customizable insights dashboards show how better speed improves user experience.
-
Connects Application and Infrastructure: The New Relic alert policy links the application name. Developers can see if problems come from the code or the server in the cloud infrastructure.
-
Detailed Transaction Data: New Relic tracks each transaction. It includes deployment events and analyzes deployment impact. The data helps developers improve Magento performance. It finds and fixes Magento 2 slow processes.
-
Real-Time Error Diagnostics: New Relic APM offers real-time error logs and stack traces. Developers use these tools to gather and transmit data and resolve errors quickly.
-
DevOps Tool Integration: New Relic is an APM software works well with Slack and PagerDuty. It makes monitoring easy to integrate into the Magento team’s regular workflow.
-
Cloud-Service Instrumentation: Commerce on cloud infrastructure projects can be monitored with Relic APM. No extra setup is needed, making it ideal for Magento 2 cloud-based apps.
-
Scalability: New Relic's customizable insights help scale business by tracking performance. It is done during the ecommerce stores' high-traffic events. Magento scalability ensures stability across staging and production environments even when demand spikes.
Comparing Magento 2 New Relic Integration with Other Monitoring Solutions
| Aspects | Magento 2 New Relic Integration | Datadog | AppDynamics |
|---|---|---|---|
| Real-Time Insights | Provides real-time insights using APM software. It monitors application performance for fast issue detection. | Offers real-time monitoring across cloud and infrastructure. | Provides real-time tracking with deep application analysis. |
| DevOps Tool Integration | Works well with DevOps tools like Slack using step-by-step guides and managed alerts. | Integrates with CI/CD pipelines and DevOps tools. | Offers integration with DevOps but may need more setup for Magento use. |
| Error Tracking | Tracks errors using managed alerts for Adobe Commerce with detailed logs. | Tracks errors but lacks Magento-specific tools like override the PHP agent's automatic features. | Tracks errors using logs and detailed stack traces. |
| Custom Dashboards | Provides customizable insights dashboards to help merchants with Magento-specific data. | Offers customizable dashboards but lacks Magento-specific insights. | Provides dashboards for applications and infrastructure but not Magento-specific. |
| Server Resource Monitoring | Monitors cloud infrastructure linked to Magento performance. | Monitors servers, databases, and cloud platforms across environments. | Ties server health directly to application performance. |
| Performance Optimization | Optimizes Magento stores using software analytics services and detailed New Relic documentation. | Provides general optimization tools, missing Magento-specific features. | Focuses on application performance but lacks Magento-specific tools. |
| Cloud-Service Support | Supports Adobe Commerce projects and cloud infrastructure include monitoring. | Monitors major cloud platforms with automatic integrations. | Requires manual configuration for Magento-specific setups. |
5 Common Mistakes to Avoid in Magento 2 New Relic Reporting
-
Ignoring Custom Thresholds: Not setting custom thresholds in use New Relic reporting. It can lead to missing issues or receiving too many unnecessary alerts. Custom thresholds ensure monitoring key performance metrics for your Magento 2 store.
-
Overlooking Key Metrics: Focusing only on general server metrics and neglecting software. It monitors application performance, which can cause missed performance bottlenecks, affecting customer experience.
-
Improper API Key Configuration: Incorrectly setting or failing to delete your API key. It can result in inaccurate reports. Always configure the API key on this page according to best practices.
-
Skipping Report Customization: Using default dashboards without customizing them. I can limit visibility into Magento-specific metrics. Custom dashboards to help merchants recognize performance trends offer better tracking.
-
Missing Cloud Integration: Not integrating software for the New Relic with cloud infrastructure. It leads to incomplete monitoring without the features. Full integration allows you to catch issues before they impact your store.
Case Studies of Successful Magento 2 New Relic Integration
1. Coupang

Coupang is American-Korean’s largest e-commerce platform. It offers a wide range of products with a focus on fast delivery. Coupoung is known for its "Rocket Delivery" service. It handles millions of daily transactions and peaks in traffic during sales events.
Challenge: During peak traffic, Coupang experienced slow response times. It causes pages to load slowly and delays transactions. The frustrated customers lead to a poor shopping experience and loss of sales.
Solution: They used APM software to monitor application performance in New Relic. The company also set up alerts to track real-time performance. It reduced response times by 30%, ensuring faster and smoother service.
2. Envato

Envato is a global marketplace offering creative assets for designers and developers. With millions of users, it provides access to a wide variety of digital content. It includes Magento 2 themes, graphics, and stock photos.
Challenge: Envato faced frequent downtime during high traffic, leading to revenue loss. It caused the site to be unavailable to users, leading to lost revenue. Customers were not able to access or purchase digital products.
Solution: Using New Relic’s software analytics service that helps identify bottlenecks. They optimized infrastructure with custom dashboards, reducing downtime by 20%.
3. Sainsbury

Sainsbury's is one of the largest supermarket chains in the UK. It offers groceries and retail products both in-store and online. Sainsbury's serves millions of customers and runs promotional sales.
Challenge: Sainsbury's experienced slow site performance during promotions, affecting customer shopping experiences. It leads to slow load times and checkout delays. Sainsbury's is increasing the chance of users leaving the site without completing purchases.
Solution: APM software is used to monitor application performance. They optimized server resources, ensuring smooth site performance during high-traffic events.
Future Trends in Magento 2 New Relic Integration
Magento 2 New Relic Integration will focus on AI tools. It will automatically detect and fix issues with APM software. The integration will monitor application performance. Businesses move to deeper integration with cloud-based infrastructure via free New Relic tools. It improves the Magento ecommerce store scalability during peak traffic.
Custom dashboards available to all Adobe Commerce users will provide better insights. Enhanced predictive analytics, built using best practices. It will help prevent performance problems before ensuring site operations.
FAQs
1. How do I integrate my New Relic account with Magento 2?
To integrate your New Relic account, start by visiting the New Relic dashboard. Follow step 1 to create your account. After creating the account, proceed to step 2 by entering your license key in Magento’s admin panel. It ensures New Relic is linked to your Magento store for monitoring.
2. How can New Relic APM help improve Magento 2 performance?
New Relic APM tracks real-time application performance. It provides alerts when performance issues occur. Use the configuration for internal reference to give you insights into server load. The alerts allow quick fixes to maintain smooth operations.
3. What are the key metrics to track with Magento 2 New Relic Integration?
Important metrics include page load times, database query speeds, and server resource usage. In the admin panel, go to the panel on the left and enter your API keys for tracking. These metrics provide insights into site performance and help with optimizations.
4. How do you set up alerts in New Relic for Magento 2?
To set up alerts, first go to the New Relic dashboard. Navigate to the panel on the left, and locate the next to insert keys section. Configure performance alerts based on industry best practices. It allows you to monitor key aspects of your Magento 2 store’s performance.
5. How does New Relic help troubleshoot a query in Magento 2?
New Relic provides detailed, real-time data on Magento 2's performance. It helps you identify issues and uses the configuration for internal reference. It tracks specific problems and offers detailed insights. It allows you to diagnose and resolve any performance problems in your store quickly.
6. How does New Relic compare with other tools for Magento 2 performance monitoring?
New Relic offers deeper insights into application performance than many other tools. It integrates with Magento 2 through the Magento Connect Marketplace. It also allows for real-time tracking and custom alerts.
Summary
Magento 2 New Relic integration monitors application performance. It integrates the store with APM software that teaches how to set up and use New Relic website. Consider the following key metrics:
-
Database Query Performance: Monitors how fast queries are executed.
-
Deployment Impact Monitoring: Tracks performance after new updates.
-
Server Resource Usage: Shows how much CPU and memory are used.
-
Tracking Across Environments: Monitors both production and staging setups.
-
Error Tracking: Detects and logs system errors.
Explore Magento server hosting and integrate New Relic for your ecommerce operations.


